

The Fed Effect
The Impact of Higher Rates Are Taking Hold
Key Observations
- Muted returns of broad market indexes for the month of April hide the churn underneath as the lagged and variable impact from higher rates take hold.
- Leading Economic Indicators (LEI) show more ardent anticipation of economic contraction. History would suggest four months or more of declining indicators is a warning of a recession. As of March 2023, the LEI index has fallen for 12 consecutive months.
- Volatility in the banking sector may reduce access to capital which may hinder economic growth.
- Our outlook for 2023 surmised the transition away from zero-bound interest rates was likely to be a bumpy one, and our views for 2023 remain unchanged with allocations designed to help weather the potential for volatility
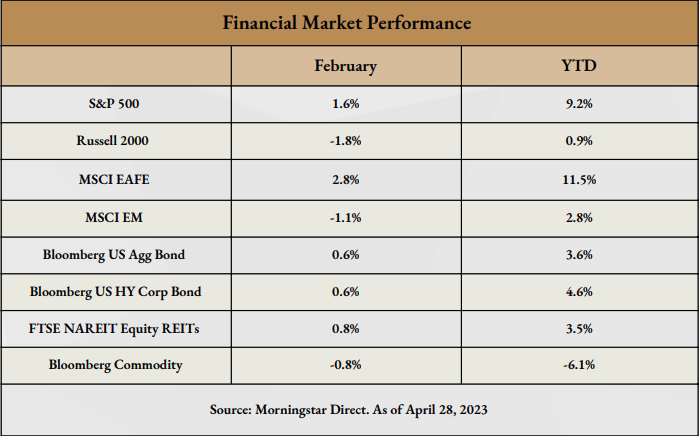
Market Recap
This report was prepared by Fiducient Advisors, a third-party vendor, and is intended for the exclusive use of clients or prospective clients of Visionary Wealth Advisors. The information contained herein is intended for the recipient, is confidential and may not be disseminated or distributed to any other person without prior approval of Visionary Wealth Advisors. Any dissemination or distribution is strictly prohibited. Information has been obtained from a variety of sources believed to be reliable though not independently verified. Any forecasts represent future expectations and actual returns, volatilities and correlations will dif er from forecasts. This report does not represent a specific investment recommendation; and no portion of this communication should be construed as a solicitation to buy or sell any specific security or investment product or to engage in any particular investment strategy. Please consult with your advisor, attorney and accountant, as appropriate, regarding specific advice. Past performance does not indicate future performance and there is a possibility of a loss. Visionary Wealth Advisors is an SEC registered investment adviser that maintains a principal place of business in the State of Missouri. The Firm may only transact business in those states in which it is notice filed or qualifies for a corresponding exemption from such requirements. For information about Visionary’s registration status and business operations, please consult the Firm’s Form ADV disclosure documents, the most recent versions of which are available on the SEC’s Investment Adviser Public Disclosure website at www.adviserinfo.sec.gov.
Use of Indices and Benchmark Return Indices cannot be invested in directly. Index performance is reported gross of fees and expenses and assumes the reinvest dividends and capital gains. Past performance does not indicate future performance and there is a possibility of a loss. See disclosure page for indices representing each asset class.
The sanguine April return of headline indexes hides the churn underneath. Equity and fixed incomes alike posted modestly positive returns overall with year-to-date trends for 2023 continuing in April; longer duration outperformed shorter duration, credit outperformed Treasuries, international developed equity outperformed the U.S. and emerging and commodities took another step back.
However, the long lag and variable impact of higher interest rates are starting to take root. A tour through April headlines including First Republic’s demise and Leading Economic Indicators (LEI) slowing gave renewed confidence to the bears while bulls gravitated to the resiliency of the labor market and early upside surprises in first quarter earnings.
Don’t Bury the Lead
Lagged indicators, such as Gross Domestic Product (GDP) or employment help measure the past but have little predictive value for the future. Leading Economic Indicators (LEI) by contrast seek to proceed economic change by looking further up the value chain. For example, a potential leading indicator of future home inventory is building permits. Unlike the strength of lagged indicators today, leading indicators have been falling.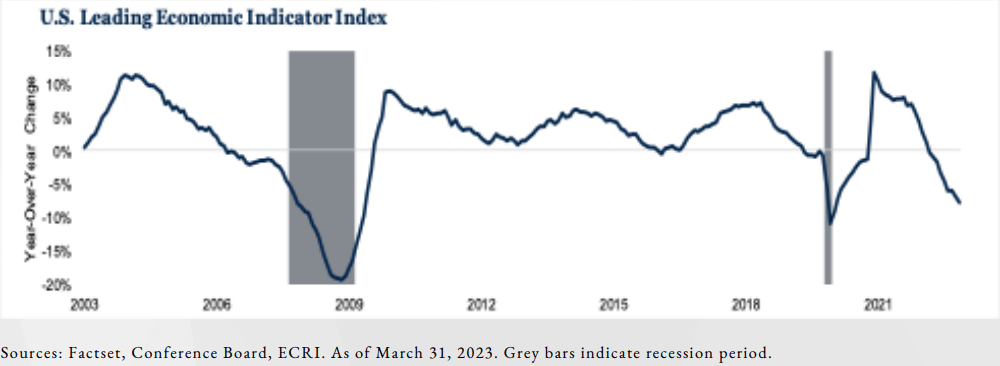
Historically, four months of falling leading indicators are enough to raise the eyebrows of economists for a potential economic slowdown. In fact, since 1993 the longest consecutive fall for the LEI index without a recession occurring was three months.
Leading up to the Global Financial Crisis, the LEI index fell 10 of the 12 months prior to the start of the recession in December 2007, eight months consecutively1. Prior to the recession in February 2001, the LEI index fell eight of the preceding 12 months, five months consecutively1. As of March 2023, the LEI index has fallen 12 of the last 12 months1. Where there is no economic law stating that a falling LEI index produces a recession, we believe it would be unwise to interpret the recent equity markets rally as an all-clear signal. Adding to this complexity is the recent volatility we have seen in the banking sector.
1. Conference Board Leading Economic Index as of March 31, 2023
The Banking Effect
An important part of the economic engine is lending. People and businesses often borrow money so1 they can purchase items. For example, individuals often do not pay all cash for a house or a car, they finance it. Businesses often do not pay all cash for inventory or equipment, they finance it. Rising interest rates have made loans more expensive, however, the additional added effect of stress in the banking sector has also made loans less available.
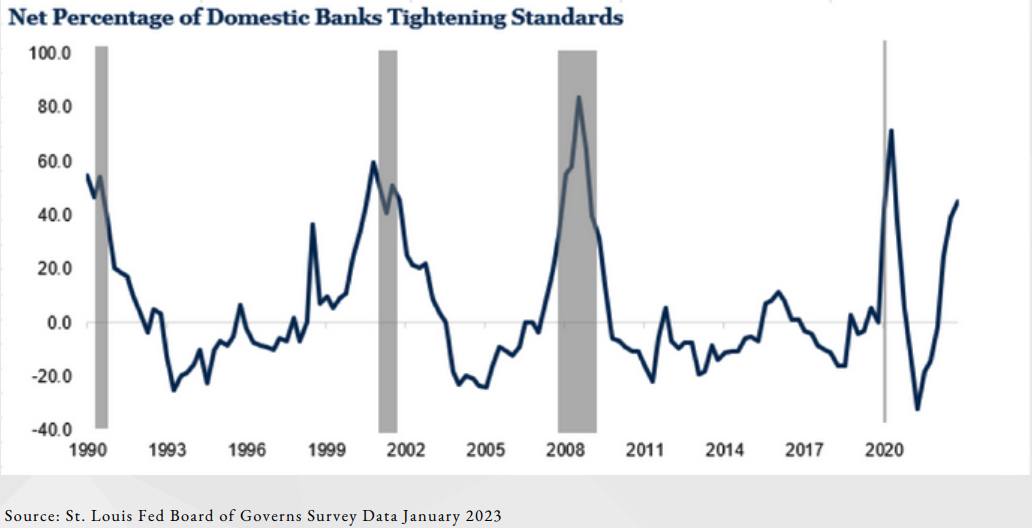
The effect of tighter standards in banking is less lending, which is a potential headwind for economic growth. The recent news of First Republic being sold to JPMorgan underscores the potential for continued tightening of lending standards putting additional pressure on the economy.
Outlook
Our 2023 outlook surmised the transition away from a zero-bound interest rate economy and market was likely to be a bumpy one. To that end our continued volatility theme helped underpin our thoughts around risk management and building resilient portfolios meant to weather a variety of economic scenarios. So, while the risk of economic contraction as we outlined above may be rising, this is not an unanticipated event. Additionally, our theme of moderating inflation appears on track with recent data showing signs of material improvement. These views reinforce our opinion that the Federal Reserve is nearing the end of its rate-hiking cycle and our proactive updates at the beginning of 2023 put us in a strong position for the markets ahead.
For more information, please contact any of the professionals at Visionary Wealth Advisors.
Comparisons to any indices referenced herein are for illustrative purposes only and are not meant to imply that actual returns or volatility will be similar to the indices. Indices cannot be invested in directly. Unmanaged index returns assume reinvestment of any and all distributions and do not reflect our fees or expenses.
- The S&P 500 is a capitalization-weighted index designed to measure performance of the broad domestic economy through changes in the aggregate market value of 500 stocks representing all major industries.
- Russell 2000 consists of the 2,000 smallest U.S. companies in the Russell 3000 index
- MSCI EAFE is an equity index which captures large and mid-cap representation across Developed Markets countries around the world, excluding the U.S. and Canada. The index covers approximately 85% of the free float-adjusted market capitalization in each country
- MSCI Emerging Markets captures large and mid-cap representation across Emerging Markets countries. The index covers approximately 85% of the free-float adjusted market capitalization in each country.
- Bloomberg U.S. Aggregate Index covers the U.S. investment grade fixed rate bond market, with index components for government and corporate securities, mortgage pass-through securities, and asset-backed securities.
- Bloomberg U.S. Corporate High Yield Index covers the universe of fixed rate, non-investment grade debt. Eurobonds and debt issues from countries designated as emerging markets (sovereign rating of Baa1/BBB+/BBB+ and below using the middle of Moody’s, S&P, and Fitch) are excluded, but Canadian and global bonds (SEC registered) of issuers in non-EMG countries are included.
- FTSE Nareit Equity REITs Index contains all Equity REITs not designed as Timber REITs or Infrastructure REITs
- Bloomberg Commodity Index is calculated on an excess return basis and reflects commodity futures price movements. The index rebalances annually weighted 2/3 by trading volume and 1/3 by world production and weight-caps are applied at the commodity, sector and group level for diversification.


