

Bear Hunting
A firm stance on fighting inflation from Jackson Hole pushed markets lower as investors wrestle with the impact on the global economy.
OCTOBER 2022 Key Observations
- Equity markets broadly enjoyed a reprieve from September lows, but fixed income and China continue to struggle in the face of a hawkish Fed and investor concerns as President Xi consolidates power.
- As investors seek answers as to when markets will bottom, we offer a framework to assess where we stand:
- Context: The average bear market lasts 14 months and we are 10 months in. With history as a guide, we are closer to the end than the beginning
- Earnings are beginning to reflect economic contraction, a healthy signal for markets to bottom
- The Fed likely needs to take its foot off the brakes before risk assets rally
Market Recap
As decisively as markets closed down in September, they rebounded in October with equal gusto. U.S. large-cap, U.S. small-cap, and developed international all moved higher, looking for a relief rally from new bear market lows in the third quarter. However, U.S. fixed income and emerging markets equity, in particular China, had no such luck. The U.S. Federal Reserve (the Fed) slammed the door on those looking for moderating rate hikes, going as far as to say “Higher interest rates, slower growth, and a softening labor market are all painful for the public that we serve. But they’re not as painful as failing to restore price stability”.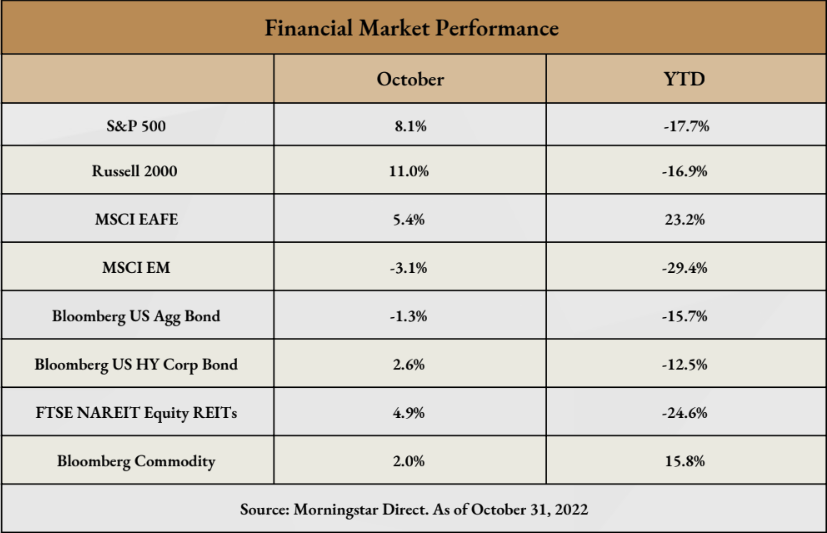
This report was prepared by Fiducient Advisors, a third-party vendor, and is intended for the exclusive use of clients or prospective clients of Visionary Wealth Advisors. The information contained herein is intended for the recipient, is confidential and may not be disseminated or distributed to any other person without prior approval of Visionary Wealth Advisors. Any dissemination or distribution is strictly prohibited. Information has been obtained from a variety of sources believed to be reliable though not independently verified. Any forecasts represent future expectations and actual returns, volatilities and correlations will differ from forecasts. This report does not represent a specific investment recommendation; and no portion of this communication should be construed as a solicitation to buy or sell any specific security or investment product or to engage in any particular investment strategy. Please consult with your advisor, attorney and accountant, as appropriate, regarding specific advice. Past performance does not indicate future performance and there is a possibility of a loss. Visionary Wealth Advisors is an SEC-registered investment adviser that maintains a principal place of business in the State of Missouri. The Firm may only transact business in those states in which it is notice filed or qualifies for a corresponding exemption from such requirements. For information about Visionary’s registration status and business operations, please consult the Firm’s Form ADV disclosure documents, the most recent versions of which are available on the SEC’s Investment Adviser Public Disclosure website at www.adviserinfo.sec.gov.
Use of Indices and Benchmark Return Indices cannot be invested in directly. Index performance is reported gross of fees and expenses and assumes the reinvest dividends and capital gains. Past performance does not indicate future performance and there is a possibility of a loss. See disclosure page for indices representing each asset class.
Market Recap
This bearish tone for bond investors added to the worst year-to-date return for the Bloomberg U.S. Aggregate Bond Index since its inception in 1972. China, the largest single country within the MSCI EM index, drove emerging markets lower. The rhetoric around President Xi’s consolidation of power and outlook following the 20th National Congress of the Chinese Party (read: the equivalent of a U.S. general election), COVID-zero policies, and concerns over Taiwanese sovereignty all weighed on investor sentiment. In fact, China is trading near Global Financial Crisis (GFC) lows based on this pessimism even though the complexion of Chinese markets today is far more attractive than in 2008/2009. These concerns and more have left investors asking what is next? With that in mind, we offer some context and a framework for how the market can bottom and what it means for us as investors.
Bear Market Bottoms
For those who know our process, it comes as no surprise we are not market timers. We believe, without question, the best way to benefit from market appreciation is to build a thoughtfully diversified allocation and hold it over the long term. We also know the long-term is a series of shorter time periods. In these short-term windows, volatility may present an opportunity. Therefore, we have to be prepared for the end of the market drawdown and what it means for our portfolios.
First, let’s build context around bear markets. Since 1950, the average pullback of 20 percent or more has lasted approximately 14 months; the longest of these was 31 months from March of 2000 to October of 2002. The shortest drawdown was less than two months in 2020. While there is no such thing as an average bear market, with history as a guide, our 10-month-old bear market is likely closer to its end than its beginning.
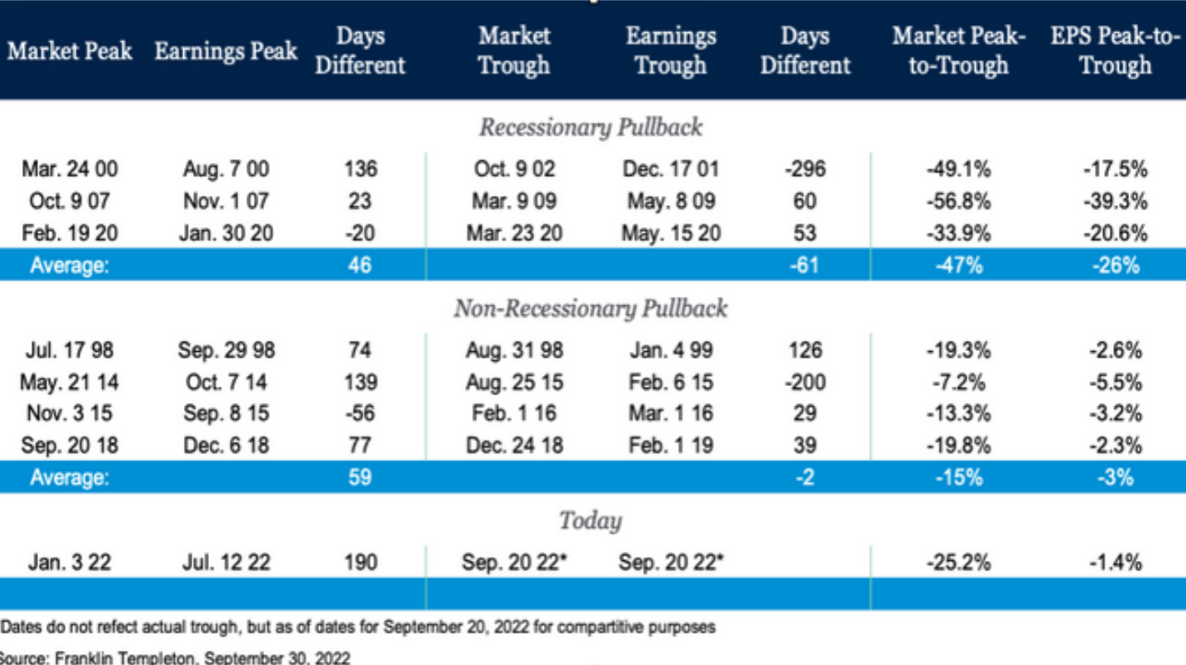
Now, how do bear markets typically unfold? Index prices can be broken down into two primary components, earnings per share (EPS) and multiples. EPS is the economic value created by businesses and what investors are buying. Multiples are how much an investor is willing to pay for those earnings. Multiples are often driven by sentiment and are one of the first things reflected in prices. Corporate earnings on the other hand are backward-looking. Moreover, the impacts on businesses from higher interest rates and/or slowing demand take time to appear in financial statements. Therefore, the typical pattern of bear markets is multiples contract first leading the market lower, followed by earnings.
This has certainly been the case in 2022 as multiples account for more than 100 percent of the pullback as earnings have been positive in 2022. The question remains, what role will earnings play in the market bottoming this time around? As shown above, there is a meaningful difference in the earnings impact in recessionary vs non-recessionary environments. Our expectations remain that if a recession takes place, it will be a modest and cyclically led recession rather than one driven by structural imbalances like during the GFC or an exogenous factor like COVID-19.
With that in mind, second and third-quarter earnings are beginning to reflect this modest economic contraction. In fact, Q2 earnings ex-energy were down -4.0 percent (up 6.2 percent with energy) and with 52 percent of the S&P 500 having reported Q3 earnings as of October 28, 2022, earnings ex-energy were down another -5.1 percent (up 2.2 percent with energy). Why ex-energy?Russia’s invasion of Ukraine propelled commodity prices up, pushing earnings for the sector up 134 percent year-to-date. The boon for energy is unique to the space and is not reflective of the rest of the market. All in, earnings are beginning to reflect the economic reality of a moderating economy in 2022. This is a healthy step forward for a bear market bottom and again suggests we are nearer the end than the beginning.
Finally, what role does the Fed play in all of this? To no surprise, given the Fed focus this year, an important one in our view. History has shown us markets tend to bottom after the Fed is done raising rates. Intuitively this makes sense. If the Fed is raising rates, they are proactively looking to cool economic activity. Yet given their dual mandates of price stability and full employment, the operative word is cool not kill. When the Fed sees modest success in controlling inflation they will stop or pause. However, the full effect of higher rates takes some time to work through into businesses and markets. It is a bit like turning the shower handle to change the temperature: you have to wait for a second to see if you got it right. Therefore, businesses are often amidst contraction when the Fed is stepping back. It is certainly conceivable that the market bottoms before the Fed officially stop increasing interest rates as it tapers back from 0.75 percent moves to 0.5 percent or less. However, the market is less likely to bottom if the Fed is accelerating or maintaining its hawkish stance.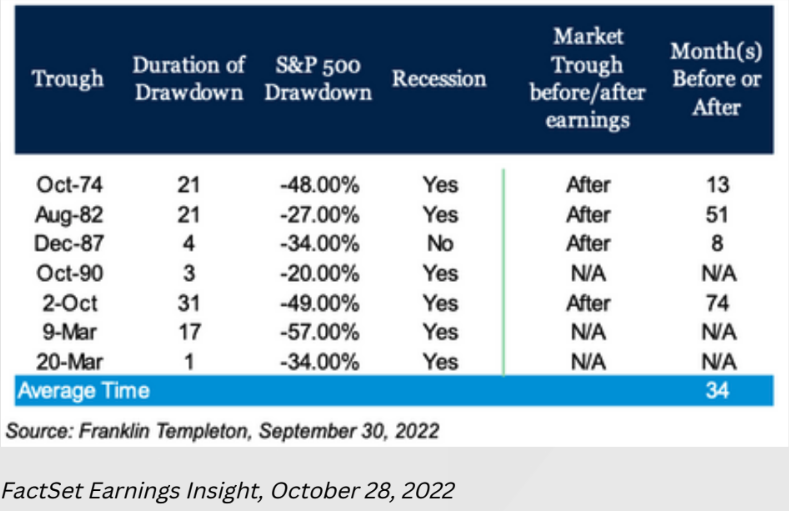
Outlook
The good news for markets is many of these conditions have been met or are near. Multiples, especially those abroad, reflect real pessimism and are priced for dire outcomes. Earnings are beginning to reflect reality and this source of volatility, as we warned in our 2022 outlook, is a healthy step forward to finding a bottom. Finally, the Fed has been on the most aggressive rate path in multiple decades. We, like all investors, do not know precisely when they will stop. However, we know they will stop and when they do it adds greater confidence and markets will once again begin to rise. As we do each year, we will expand upon these views and more in our 2023 outlook which will be released in the coming weeks.
For more information, please contact any of the professionals at Visionary Wealth Advisors.
Comparisons to any indices referenced herein are for illustrative purposes only and are not meant to imply that actual returns or volatility will be similar to the indices. Indices cannot be invested in directly. Unmanaged index returns assume reinvestment of any and all distributions and do not reflect our fees or expenses.
Use of Indices and Benchmark Return Indices cannot be invested in directly. Index performance is reported gross of fees and expenses and assumes the reinvest dividends and capital gains. Past performance does not indicate future performance and there is a possibility of a loss. See the disclosure page for indices representing each asset class.
- The S&P 500 is a capitalization-weighted index designed to measure the performance of the broad domestic economy through changes in the aggregate market value of 500 stocks representing all major industries. Russell 2000 consists of the 2,000 smallest U.S. companies in the Russell 3000 index.
- MSCI EAFE is an equity index that captures large and mid-cap representation across Developed Markets countries around the world, excluding the U.S. and Canada. The index covers approximately 85% of the free float-adjusted market capitalization in each country.
- MSCI Emerging Markets captures large and mid-cap representation across Emerging Markets countries. The index covers approximately 85% of the free-float adjusted market capitalization in each country. Bloomberg U.S. Aggregate Index covers the U.S. investment grade fixed rate bond market, with index components for government and corporate securities, mortgage pass-through securities, and asset-backed securities.
- Bloomberg U.S. Corporate High Yield Index covers the universe of fixed rate, non-investment grade debt. Eurobonds and debt issues from countries designated as emerging markets (sovereign rating of Baa1/BBB+/BBB+ and below using the middle of Moody’s, S&P, and Fitch) are excluded, but Canadian and global bonds (SEC registered) of issuers in non-EMG countries are included.
- FTSE Nareit Equity REITs Index contains all Equity REITs not designed as Timber REITs or Infrastructure REITs.
- Bloomberg Commodity Index is calculated on an excess return basis and reflects commodity futures price movements. The index rebalances annually weighted 2/3 by trading volume and 1/3 by world production and weight-caps are applied at the commodity, sector, and group level for diversification.


