
Market Start 2023 Off With a Bang
Filter out the noise and stay the course.
January 2023
Key Observations
- Broad asset classes rose higher off 2022 lows on cooling pricing pressures and the possibility of a Fed pause
- Equities abroad outperformed amid a declining U.S. dollar and higher than expected growth
- The U.S. debt ceiling has sparked conversation, however the need for a resolution will likely abate an insolvency crisis
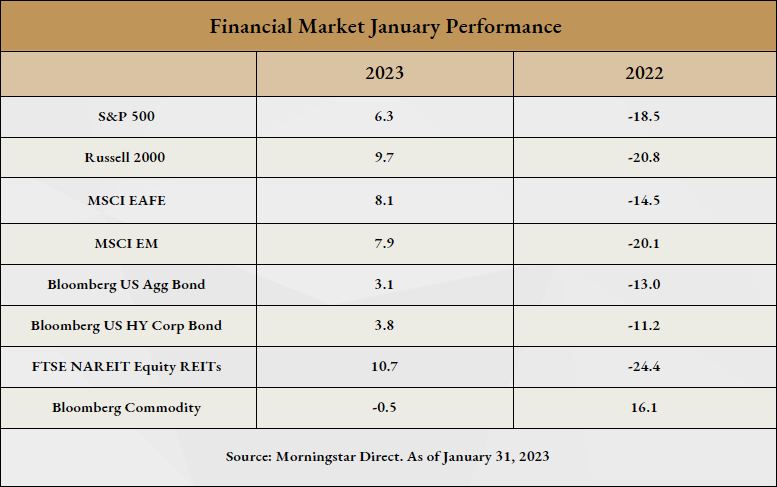
Market Recap
This report was prepared by Fiducient Advisors, a third-party vendor, and is intended for the exclusive use of clients or prospective clients of Visionary Wealth Advisors. The information contained herein is intended for the recipient, is confidential and may not be disseminated or distributed to any other person without prior approval of Visionary Wealth Advisors. Any dissemination or distribution is strictly prohibited. Information has been obtained from a variety of sources believed to be reliable though not independently verified. Any forecasts represent future expectations and actual returns, volatilities and correlations will differ from forecasts. This report does not represent a specific investment recommendation; and no portion of this communication should be construed as a solicitation to buy or sell any specific security or investment product or to engage in any particular investment strategy. Please consult with your advisor, attorney and accountant, as appropriate, regarding specific advice. Past performance does not indicate future performance and there is a possibility of a loss. Visionary Wealth Advisors is an SEC registered investment adviser that maintains a principal place of business in the State of Missouri. The Firm may only transact business in those states in which it is notice filed or qualifies for a corresponding exemption from such requirements. For information about Visionary’s registration status and business operations, please consult the Firm’s Form ADV disclosure documents, the most recent versions of which are available on the SEC’s Investment Adviser Public Disclosure website at www.adviserinfo.sec.gov.
Use of Indices and Benchmark Return Indices cannot be invested in directly. Index performance is reported gross of fees and expenses and assumes the reinvest dividends and capital gains. Past performance does not indicate future performance and there is a possibility of a loss. See disclosure page for indices representing each asset class.
Broad asset classes kicked off the new year higher after a not-so-jolly December. Sentiment turned decidedly positive based on slowing wage and job growth and cooling price pressures. These trends provided optimism for a less hawkish Fed pushing investor expectations from a 0.50% Fed move in February to a 0.25% as of January 31, 2023. Optimism was tempered as investors assess how the economy is weathering higher interest rates, with retail sales and producer pricing showing signs of slowing in the U.S. economy. While these appear to be signs the Fed’s fight against inflation may be working, investors continue to weigh the economic cost and viability of a “soft landing” scenario.
Fixed income markets saw a bright start to the year after a muted December, with the 10-year U.S. Treasury yield dropping35 basis points (bps) as investor demand increased largely on more attractive yields. The yield curve remained invertedwith the 10-year Treasury 68 bps below the two year. Lower quality, high yield bonds outperformed investment grade as sentiment turned positive.
The S&P 500 returned 6.3% with domestic winners coming from small caps (+9.7%) and growth-oriented securities(+8.4%). Higher interest rates in 2022 had a material influence on high-growth businesses like the technology sector which lagged many other parts of the market. A more moderate Fed helped fuel their bounce back and the technology-heavy NASDAQ marked its best start to the year since 2001 up 10.7%.2 Non-U.S. equities rose in the month and widely outpaced their domestic counterparts with tailwinds from a declining U.S. dollar, higher than expected growth in Europe and positive sentiment around China easing restrictions on zero-COVID policies.
Diversifying and inflation sensitive areas of the market such as REITs and commodities were bifurcated in performance,with REITs rallying from 2022 lows and a warmer winter in Europe dragging energy prices and commodities slightly lower.
The Debt Ceiling
Historically this budgeting statute has been more procedural than material. However, recent rising debt-to-GDP levels and partisan politics turned procedure into brinksmanship; and similar standoffs in 2011 and 2013 resulted in market volatility. In all, we believe manufactured crises like these are more noise than signal when it comes to a sound investment strategy. In our recent blog post, The Debt Ceiling Distraction, we unpack why we believe this may be an issue that grows over time, but ultimately is resolved without creating lasting systematic issues.
Outlook
Fresh off our 2023 Outlook – Goodbye TINA research paper, we believe elevated volatility, moderating inflation and markets finding a bottom following the 2022 route will be key factors to position portfolios in 2023. Headline CPI data in December gave us a fresh look into moderating inflation. While year-over-year inflation grew at 6.5%, annualized inflation over the last six months was just 0.34% providing optimism for a soft landing and the Fed moderating their hawkish stance. It is perhaps too early to claim victory on price stability, however, these are steps in the right direction.As for what inflation and higher rates are doing to company earnings, those impacts are just coming to the surface with the majority of fourth quarter 2022 earnings data being released in February. The barrage of layoff headlines in sectors most impacted in the recent pullback may be an early signal of what is to come from the final quarter of 2022. This incremental information continues to support our positioning of building greater resiliency in portfolios while positioning for upside potential.
For more information, please contact any of the professionals at Visionary Wealth Advisors.
Comparisons to any indices referenced herein are for illustrative purposes only and are not meant to imply that actual returns or volatility will be similar to the indices. Indices cannot be invested in directly. Unmanaged index returns assume reinvestment of any and all distributions and do not reflect our fees or expenses.
- The S&P 500 is a capitalization-weighted index designed to measure performance of the broad domestic economy through changes in the aggregate market value of 500 stocks representing all major industries.
- Russell 2000 consists of the 2,000 smallest U.S. companies in the Russell 3000 index.
- MSCI EAFE is an equity index which captures large and mid-cap representation across Developed Markets countries around the world, excluding the U.S. and Canada. The index covers approximately 85% of the free float-adjusted market capitalization in each country.
- MSCI Emerging Markets captures large and mid-cap representation across Emerging Markets countries. The index covers approximately 85% of the free-float adjusted market capitalization in each country.
- Bloomberg U.S. Aggregate Index covers the U.S. investment grade fixed rate bond market, with index components for government and corporate securities, mortgage pass-through securities, and asset-backed securities.
- Bloomberg U.S. Corporate High Yield Index covers the universe of fixed rate, non-investment grade debt. Eurobonds and debt issues from countries designated as emerging markets (sovereign rating of Baa1/BBB+/BBB+ and below using the middle ofMoody’s, S&P, and Fitch) are excluded, but Canadian and global bonds (SEC registered) of issuers in non-EMG countries are included.
- FTSE Nareit Equity REITs Index contains all Equity REITs not designed as Timber REITs or Infrastructure REITs.
- Bloomberg Commodity Index is calculated on an excess return basis and reflects commodity futures price movements. The index rebalances annually weighted 2/3 by trading volume and 1/3 by world production and weight-caps are applied at the commodity, sector and group level for diversification.


